 Help Center
Grubbs test to detect outliers in Excel tutorial
This tutorial shows how to compute and interpret a Grubbs test to detect outliers analysis in Excel using the XLSTAT software.
Dataset for testing outliers with Grubbs test
An Excel sheet with both the data and the results can be downloaded by clicking on the link above.
The data have been obtained from a normal distribution with mean 0 and variance 3. One outlier has been added. We wish to test if there is one outlier in the sample.
Goal of this tutorial
We would like to detect an outlier from a sample using Grubbs test.
Setting up a Grubbs test to detect an outlier
To start the Grubbs test go to the menu Testing outliers / Grubbs test.

In the General tab, select the data and the Grubbs test option (the Double Grubbs test can be used to detect two outliers).
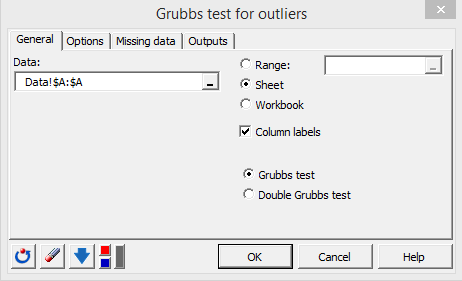
As an alternative hypothesis choose the two-sided option. The default significance level is left as is: 5%.

When ready click on OK.
Results of a test for detecting an outlier
The result is that the p-value for this test is slaller than 0.0001. That means that the null hypothesis should be rejected.

In the following table, the detected outlier is given.

You can also find the Z score to detect outliers in the output of this test.
Was this article useful?
- Yes
- No